

3
UA-24279210-1---

產品中心
Raman-SNOM顯微鏡-alpha300RS
發布時間: 2020-10-07 15:22
Witec
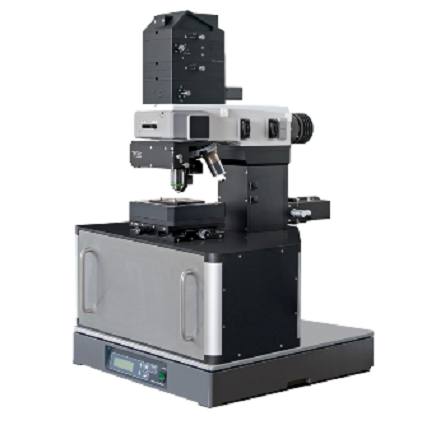


Raman拉曼-SNOM掃描近場光學顯微鏡-alpha300 RS
alpha300 RS是一套將共焦拉曼成像與突破衍射極限的掃描近場光學顯微鏡結合的光學成像聯用系統,非常適用於具備高挑戰性實驗要求的用戶。alpha300 RS 集alpha300 S和alpha300 R全部功能以及許多原子力操作模式於一身。拉曼-SNOM顯微鏡聯用同樣適用於高分辨率拉曼成像技術,如近場拉曼成像。alpha300RS顯微鏡特點:
- 集 alpha300 R(拉曼)和 alpha300 S(SNOM)顯微鏡的全部功能於一身
- 高分辨率表面成像技術(SNOM)和化學成像技術(拉曼)的完美結合
- 非常適合近場拉曼成像等聯用技術
- 只需轉動物鏡塔輪,即可在兩種測量技術之間進行輕鬆切換
- 測試過程中無需移動樣品
 Left: Topography image of exfoliated graphene simultaneously determined during the nearfield-Raman measurement with corresponding topography curve measured along the blue line. Right: Nearfield-Raman image of the same sample area of the G-band intensity with corresponding intensity graph measured along the red line. |


服務熱線:886-2-2655-2200 業務咨詢:151 / 維修校正:185
產品
文章
搜索
名稱描述內容
【關鍵字搜索】:
請於欄位下方先點選"內容"
當前位置: